Patching the Leaky Pipeline
A project for my statistics course to test whether female PIs at ISTA have more female members in their group.
Here are the slides for the project, and reach out to me if you want the code!
At the beginning of the fall semester of my PhD in October 2024, I took a course called Experimental Design and Statistics for Life Scientists where we had to present our own statistics project towards the end of the course. I took this opportunity to explore the representation of women in STEM, especially at the Institute of Science and Technology Austria (ISTA) where I’m doing my PhD. I was inspired by a documentary I’d watched on the challenges of being a woman in STEM, called Picture A Scientist by Sharon Shattuck and Ian Cheney. In the documentary they describe a phenomenon called the Leaky Pipeline.
Leaky pipeline is the phenomenon where the proportion of women in academia progressively falls with progressing positions. While we might start out with a 50-50 ratio in the undergraduate class, the proportion of women goes down in graduate degree and keeps falling across PhD, post-doc, assisstant professor and tenured professor positions. For instance, a report by Center for American Progress (in 2009) showed that married mothers are 35% less likely than married fathers to enter the tenure track and 27% less likely to get the tenure track position. There are several reasons for the leaky pipeline, including systemic problems in academia, societal expectations of famly dynamics and outright bias and discrimination (I highly recommend the documentary to learn more about this).
Why should anyone care about the inclusion of women (or any underrepresented group) in science and academia? Dr. Carl Goodrich gave a succinct answer in his talk in 2023, that you could use to convince others as well. The first is the Idealist argument that we should strive for an ideal world where everyone has equal opportunities to pursue their goals and interests, irrespective of their identity. The second is the Scietific argument, that by including women in STEM, we would have twice the number of people working on problems and we could solve them faster by bringing in new perspectives. The third one is the Selfish argument, that if we make changes to the system to make it accessible for more women to stay in academia, it would benefit everyone else too. For instance, organising conferences with longer notice period or having childcare at work would benefit all parents and not just mothers.
In addition to systemic changes, some studies in US undergraduate colleges have shown that there could be Role Model effect where having more female professors would encourage more female students to take additional courses or pursue a major in the field. In contradiction to this, another study found no relation between number of female professors in the department and the number of female students deciding to major in that department. In this context, I wanted to do a statistical study of whether there was a leaky pipeline at ISTA, and if yes, did female PIs have more female members in their group than male PIs?
Collecting the data
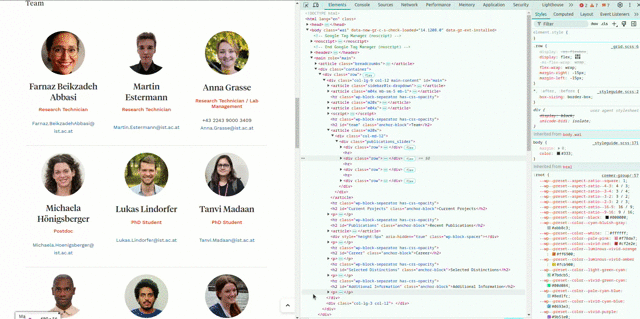
In order to do this analysis, I needed to know the number of male and female individuals at different positions (lab managers, PhD, post-doc, asisstant professor and professor) and across different disciplines (biology, neuroscience, physics, math and so on). Of course, I couldn’t ask the institute for this information, so I decided to get this information from the ISTA faculty page where they have a list of faculty and linked to their profile, are all the people associated with their group. I used a Python package for web scraping called BeautifulSoup to extract the names and positions of all individuals from the HTML file of the website as shown in the GIF below.
Once I had the names and positions of everyone in a CSV file, I exluded interns and visiting students and I was left with 687 people, out of which 85 were Principal Investigators (PIs) with their own groups. I had to find a way to automate assigning sex, and I found a website called Genderize.io that assigns sex if given the first name. I used their paid subscription to assign sex with a list of first names in a CSV file.
In addition to this, I obtained the field of the PIs from the Communications team at ISTA who had published the figures in their last annual report. Combining all of this, I obtained the number of females in different positions and fields, along with the sex of the PIs and the proportion of female members in their labs. Time for the analysis!
A Leaky Pipeline
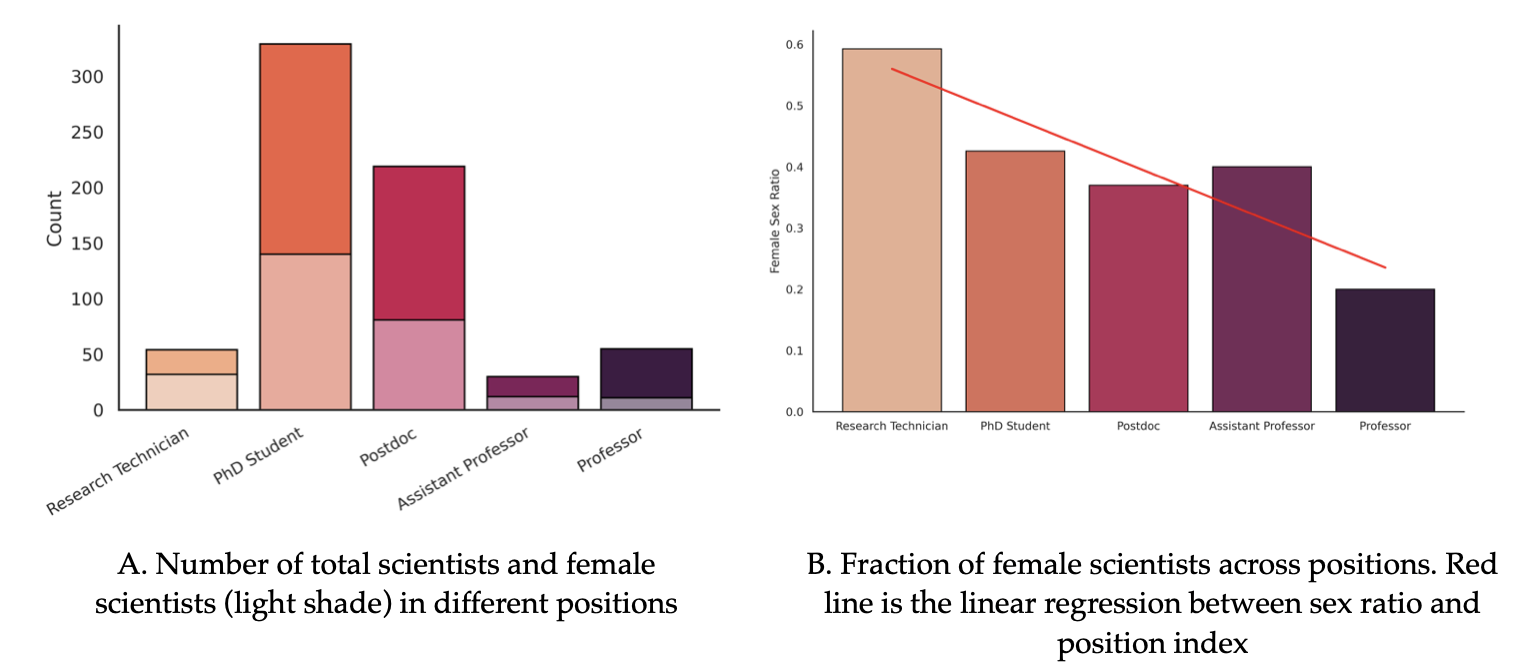
The plot on the left depicts the distribution of scientists (and female scientists in a lighter shade) across different positions. What clearly stands out is that PhD candidates make up about half the scientific population at ISTA. When we plot the proportion of female individuals across different positions, we see a clear decrease from techniciancs, PhD to postdoc to professor positions. In order to check if there is a significant correlation between sex ratio and academic position, I did a non-parametric Spearman Rank Test using the indices of the positions (the red linear regression line is for visualisation of the negative correlation). The result (ρ=–0.899, p-value=0.0373) points to a leaky pipeline that’s still active today. But, it’s heartening to note that the proportion of female assistant professors is slightly higher than that of post-docs, which is a step towards later improving the sex ratio in the professor bin.
Female sex ratio across fields
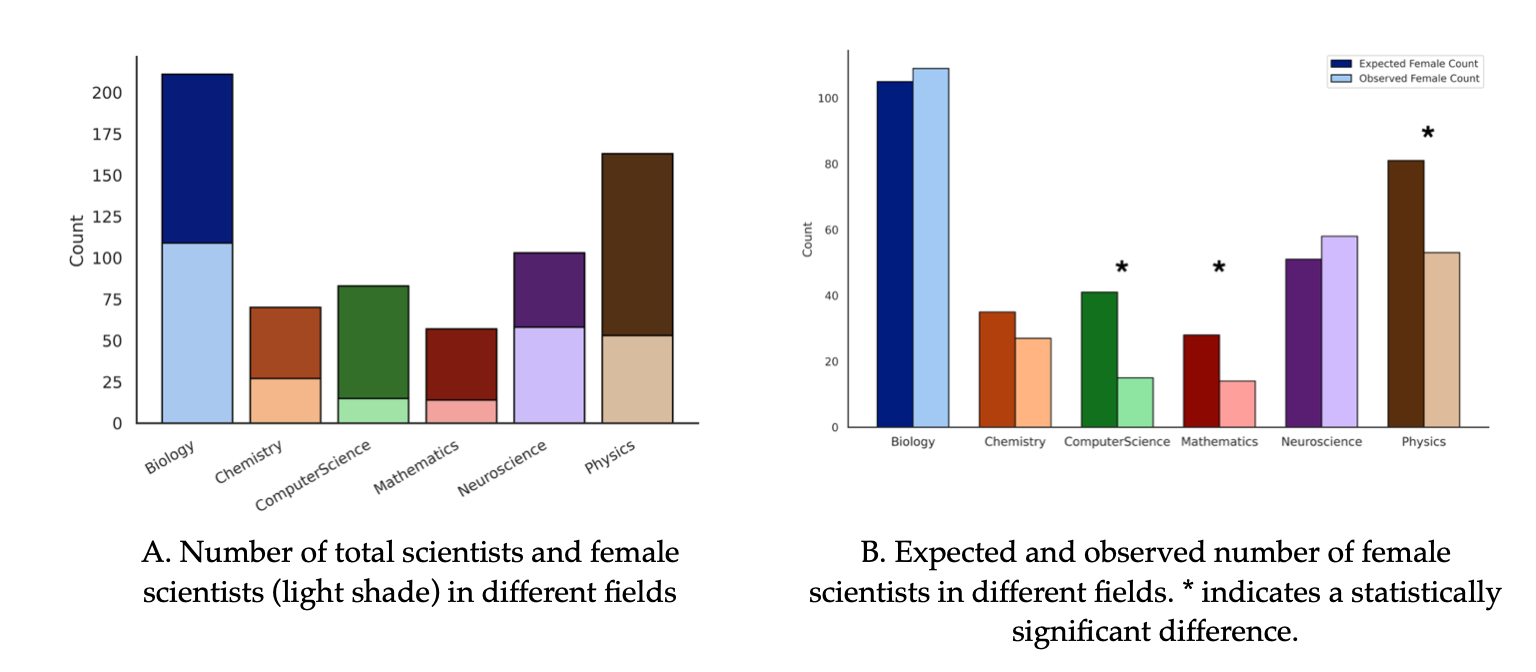
Next, I wanted to check if the female sex ratio is worse in some disciplines as compared to others. To determine this, I compared the expected number of females in each field (ideally, half of the total number of people) with the observed number of females in that discipline. The left figure depicts the observed number of male and female researchers in each discipline. On the right, we see a comparison of the observed and expected number of female researchers in each discipline. I tested if each comparison is significantly different using a one-dimensional Chi-square test with the Bonferroni correction. Unsurprisingly, the sex ratio in physics, mathematics and computer science are significantly different from the expected 0.5.
Do female PIs have more female members in their groups?
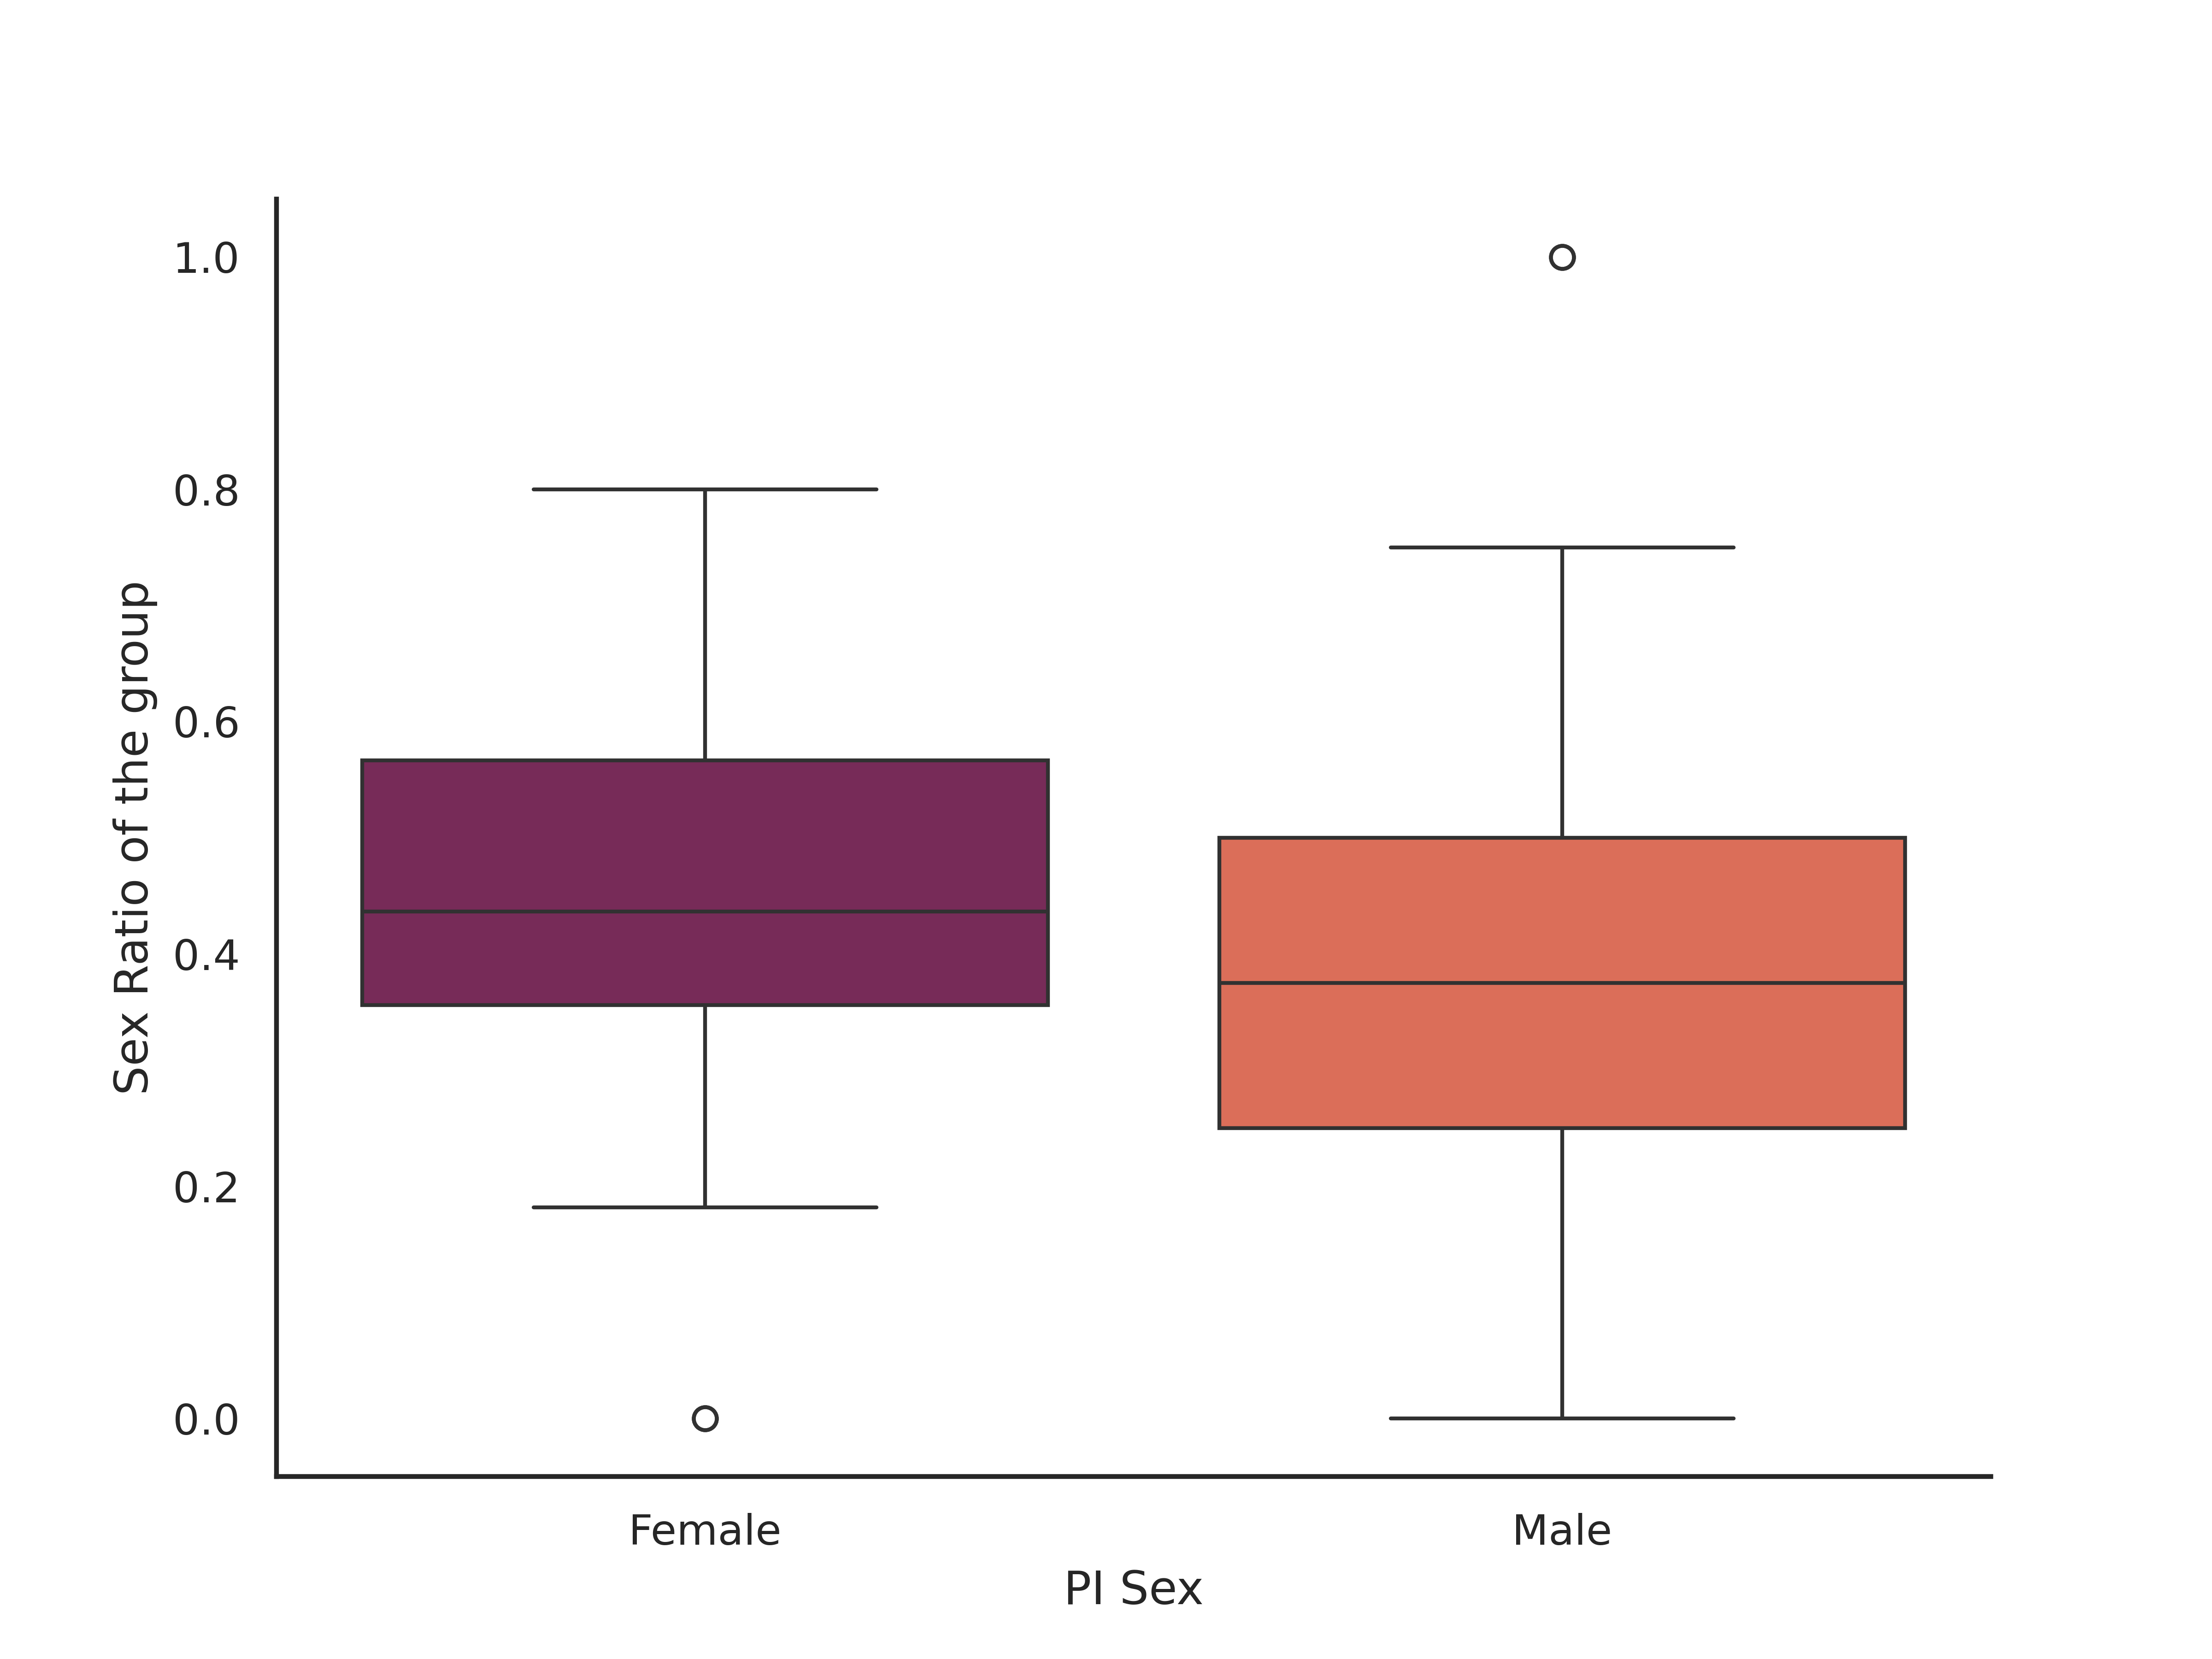 Once I had established that there is indeed a leaky pipeline and that it affects different disciplines disproportionately, I wanted to test the main question - do female PIs at ISTA have more female PhD students? After confirming that the data is normally distributed and has similar variance, I checked if there was a significant difference in th sex ratio of groups lead by male and female PIs using a Student’s T-test. The test revealed (statistic = 1.039, p-value = 0.301, df = 77) that the difference is not significant, and we cannot reject the assumption that male and female PIs have similar proportion of female students.
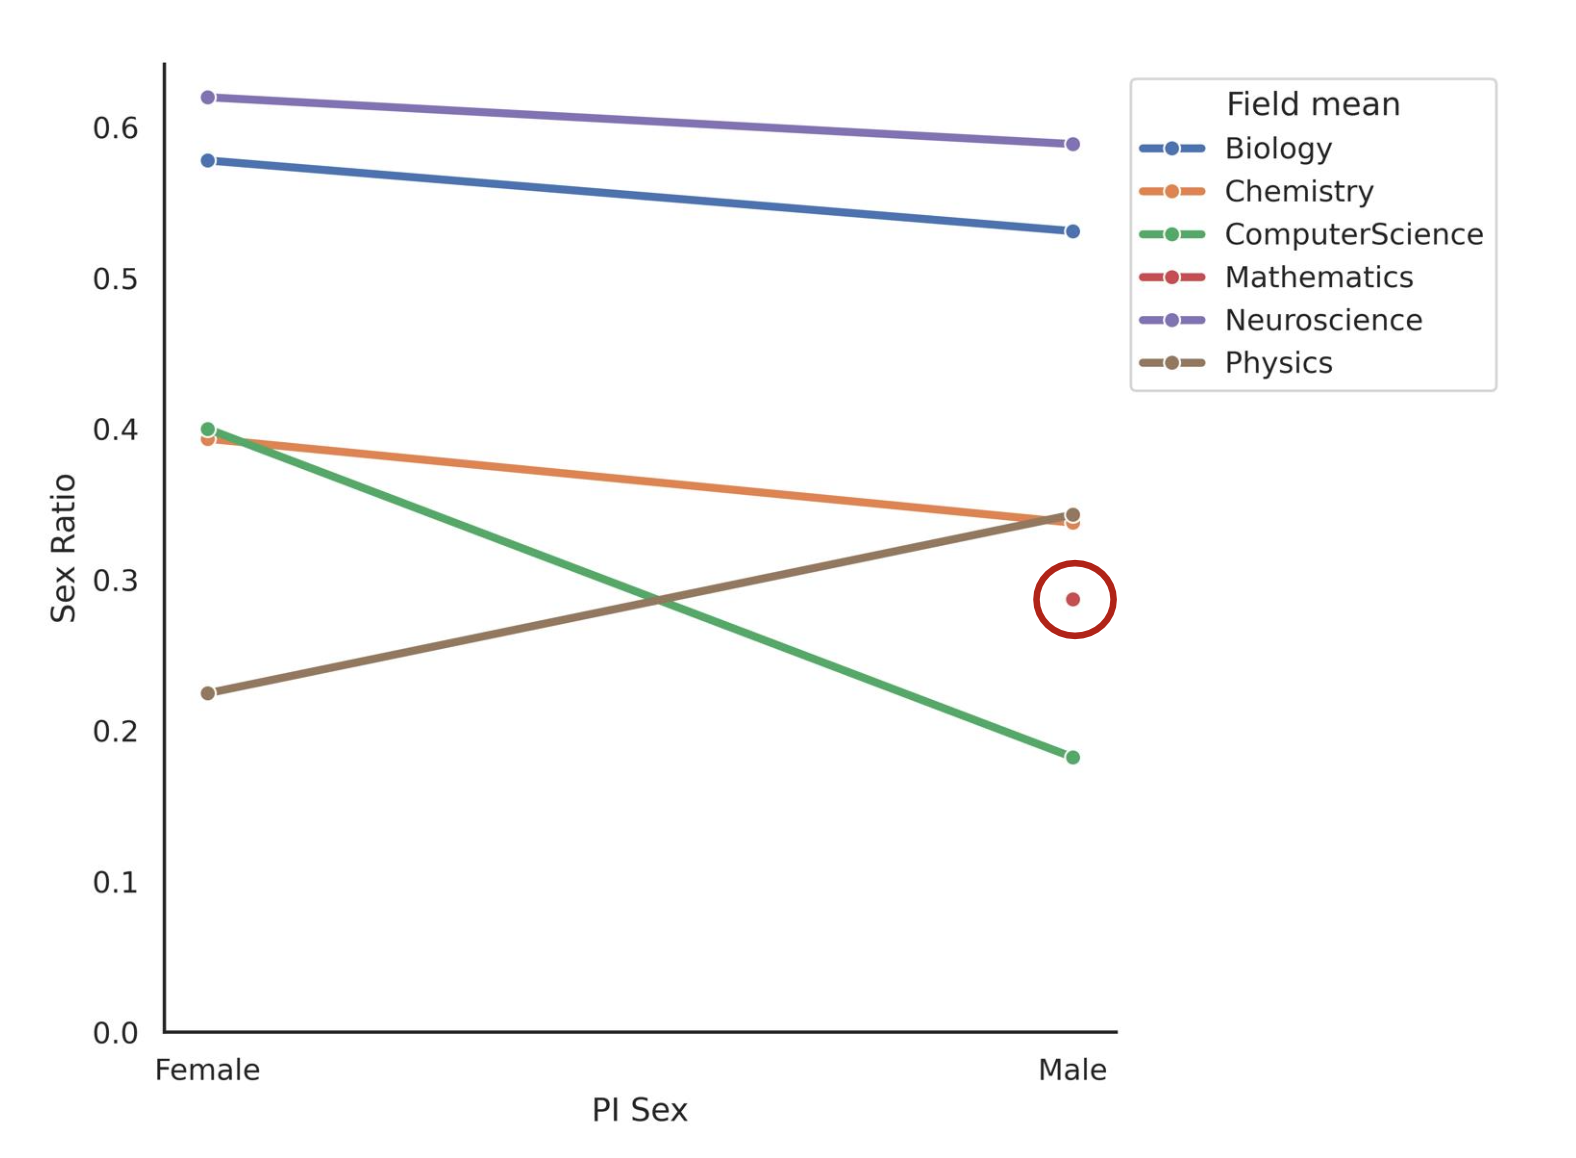
Since I had observed a difference across disciplines, I wanted to test if female PIs in certain disciplines (such as math and physics) have a higher proportion of female scientists in their groups. I wanted to do a pair-wise MannWhitney-U test between male and female PIs in each discipline, but I couldn’t because the mathematics department at ISTA in 2024 didn’t have even a single female PI (out of 9 PIs) and the computer science department had only one female PI (1/11 PIs). This already points to a stark gap in the institute. But, from the figure below, we can see the expected trend in Chemistry and Computer Science, but not in Physics. Alas, we cannot draw any conclusions from such trends.
In a final attempt, I tried to model the sex ratio using GLMs, with the sex ratio as the response variable, the sex of the PI and their field as the response variables, and the binomial distribution for proportion data. I played around with different variables, but the sex of the PI was never a significant predictor of the sex ratio in a group. Hence, we can say that male and female PIs have similar proportion of female scientists in their group.
Discussion
As of November 2024, we see that there’s a significant difference in the proportion of female scientists along advancing academic stages and across various disciplines. But there’s no significant difference in the group sex ratio of male and female PIs, which is a good thing, considering we don’t have enough female PIs in disciplines affected by a signficant gender gap (mathematics and computer science). But these conclusions come with a slew of contingencies - the numbers are a snapshot of a system in flux. We might learn a lot more by analysing the effects of age and size of the groups as they evolve. In addition to this, I have exlcuded interns from the data because I couldn’t get reliable numbers. ISTA also prides itself on being interdisciplinary and lacking impervious ‘departments’ - in this context, the disciplines assigned to the PIs could be shifted quite easily, which might affect some of the results.
Taking a step back, I want to emphasize that although my categories were binary, biological sex is a spectrum (read more at Evolution’s Rainbow by Dr. Joan Roughgarden). Another important aspect in studying the composition of any workspace (but outside the scope of this project) is to consider the intersectionality of other factors, such as, nationality, race, language, sexuality and so on. They all shape an individual’s experience and their trajectory.
It’s not surprising that we see gender disparities in mathematics, computer science and physics which are cosndered as “hard” sciences, in contrast to the “softer” biology, humanities and social sciences. In addition to working towards better representation in science, it’s also important to apply feminist thinking in doing science, as sociologist Prof. Gita Chaddha talks about in her lecture, ‘STEMinism’ and Feminism.
Finally, I really enjoyed working on this fun project on the side, especially because it was an answerable question (whatever the answer might be!) and I enjoyed the process of figuring out how to get there.
Acknowledgements
I am grateful to Prof. Sylvia Cremer and the Statistics course at ISTA for the opportunity to work on such a project. I’m thankful to Lukas Lindorfer (TA) and Tobias Nimpf (ISTA Communications office) for their support.
Further reading
- Goulden, Marc. Frasch, Karie, and Mason, Mary Ann. 2009. “Patching America’s Leaky Pipeline in the Sciences.” Center for American Progress. Berkeley Law University of California. https://www.americanprogress.org/article/staying-competitive/
- Bettinger, Eric P, and Bridget Terry Long. 2005. “Do Faculty Serve as Role Models? The Impact of Instructor Gender on Female Students.” American Economic Review 95 (2): 152–57. https://doi.org/10.1257/000282805774670149.
- Canes, Brandice J., and Harvey S. Rosen. 1995. “Following in Her Footsteps? Faculty Gender Composition and Women’s Choices of College Majors.” ILR Review 48 (3): 486–504. https://doi.org/10.1177/001979399504800308.
- Rask, Kevin N., and Elizabeth M. Bailey. 2002. “Are Faculty Role Models? Evidence from Major Choice in an Undergraduate Institution.” The Journal of Economic Education 33 (2): 99–124. https://doi.org/10.1080/00220480209596461.
- “Women Have Disrupted Research on Bird Song, and Show How Diversity Can Improve All Fields of Science.” 2020. Nature Index. September 16, 2020. https://www.nature.com/nature-index/news/women-scientists-have-disrupted-research-on-bird-song-diversity-in-stem.